Since the VAPS is a Gantt Chart, it naturally has all its characteristics and elements:
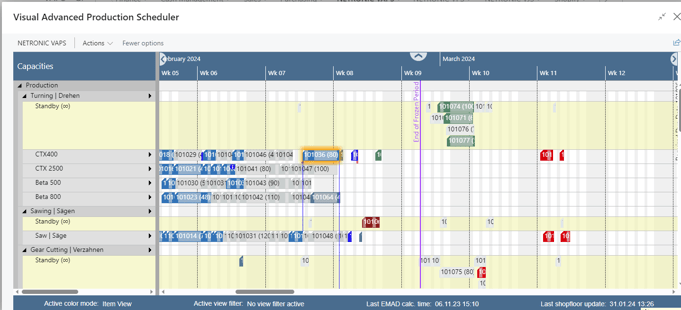
- A time scale at the top.
- A table at the left.
- On the right below the time scale, a diagram displaying the schedule with a calendar in the background indicating work-free periods in grey while working times appear in white.
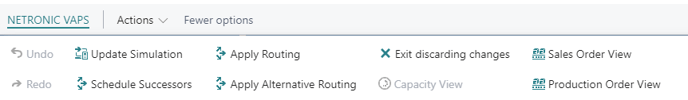
- A menu ribbon is placed above the plan, the item “NETRONIC VAPS” summarizing all menu options that we think are the most frequently used ones:
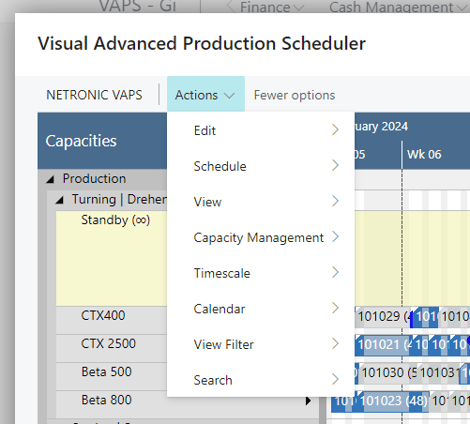
All options of the VAPS can be found under “Actions”:
In case the “Actions” item is not visible in the menu ribbon, click “More options". To hide it again, click “Fewer options”.
Please note, that, depending on the task you are currently working on (setting up the VAPS, working in a simulation, etc., the contents of the menu ribbon will differ.
-
An interacitve status area can be shown below the visual schedule, providing the planners with useful information about
-
Whether new warehouse activity line or shopfloor data is available. Clickable to load the new data.
-
The active color mode, clickable to select another mode.
-
Whether a view filter or the focus mode is active. Clickable to choose another filter.
-
The last time the EMAD was calculated.
-
The last time the schedule was updated with shopfloor data.
-

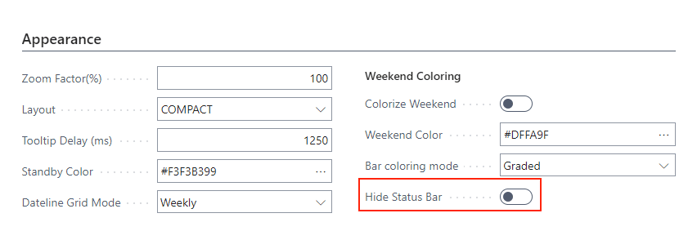
The status area is activated by default but can be switched off in the "Appearance" area of the VAPS setup.