For detailed information about the differences between the two modes see below Viewer Mode vs Scheduler Mode.
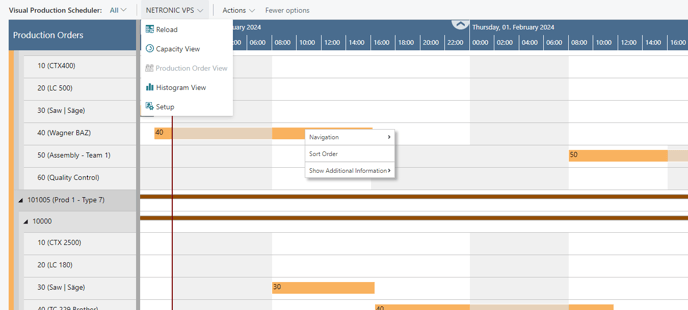
Since the VPS is a Gantt Chart, it naturally has all its characteristics and elements
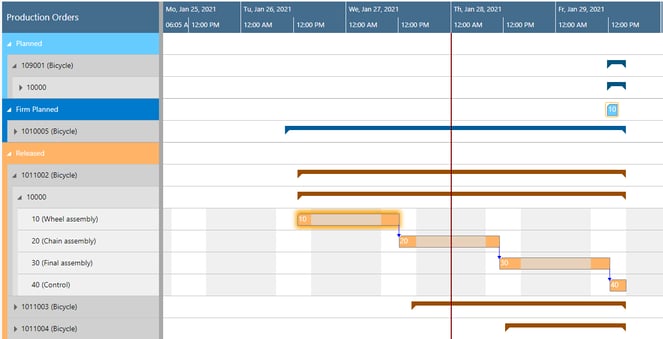
- A timescale at the top.
- A table at the left, production orders (in the Production Order View) or work and machine centers in the Capacity View
- On the right below the time scale, a chart displaying the job schedule with a calendar in the background indicating work-free periods in grey while working times appear in white.
- A menu ribbon, allowing to make basic settings that will be explained in detail in the following. For detailed information, see chapter "The menu ribbon of the VPS".

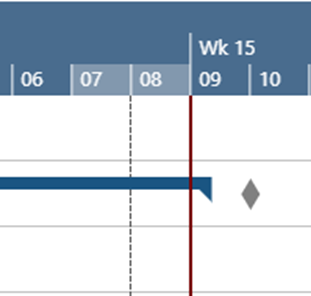
- A vertical line in the chart indicates the work date as having been set in Dynamics 365 Business Central.

- A blue dashed line indicates the time when your plan was last updated.
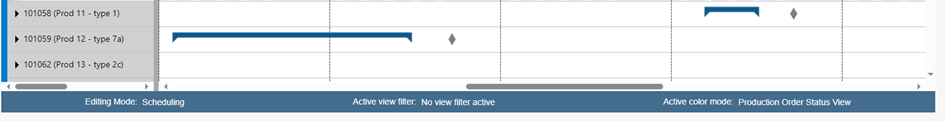
- An interactive status bar:
In the world of visual scheduling, it's easy for planners to get lost in a sea of data and wonder why they're seeing certain information. The status bar below the Gantt chart ensures that planners always know what they're looking at and provides real-time information about:-
The current editing mode.
-
The active view filters, or whether no filter is active.
-
The active color mode.
-
In the "Appearance Section" of the VPS Setup dialog, you can specify whether to show/hide the status bar.

Viewer Mode vs Scheduler Mode
In the earlier days when Business Central was known as Dynamics NAV, we offered a VPS planner license and a VPS viewer license. With the transition to Business Central, we just had one VPS license, enabling widespread access for schedule adjustments. If customers wanted only certain people to be able to make changes, we basically left it up to them to ensure this through appropriate processes and training.
Over time, spurred by customers' feedback and evolving needs, we recognized scenarios where a visual production schedule in a view-only mode could be invaluable. This led to the development of the VPS Viewer Mode.
Why and how: VPS Viewer Mode
There are use cases, where “non-production-scheduling-people” want to see the production schedule. Examples:
- Sales
- What: check and understand the general production backlog
- Why: derive conclusions for delivery time commitments
- Shopfloor workers
- What: see which production orders are scheduled for today
- Why: make operational decisions (if allowed)
We built the VPS Viewer Mode with all cases in mind but focused on the shopfloor
- Sales = open schedule, assess backlog, make conclusion, close schedule
- Shopfloor = schedule “always on” … on a screen on the floor
- Needs to show a fixed period
- Needs to be pre-filtered
- Needs to update automatically
In the Viewer Mode, all options for changing the schedule are deactivated and the corresponding menus and functionalities – also for saving - are hidden. However, changes to Business Central data are still possible via the Business Central pages!
As usual, the progress window is displayed during reloading. If the user was previously working as a planner, changed data there, and then switched to the viewer mode, the changed data will be overwritten without prompting (saving is not provided in the viewer mode).
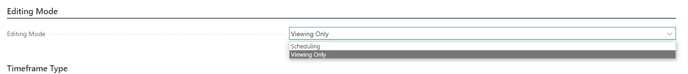
How to switch between Viewer Mode and Scheduling Mode
The mode can be selected by the according option in the new “Editing Mode” area in the VPS setup. The Scheduling Mode is preset as default.
Depending on the selected mode, the settings offered in the “Automatic Screen Updates” area of the Setup dialog differ:
Viewer mode:
- whether and how often the view should be updated
- whether and how often the view should scroll
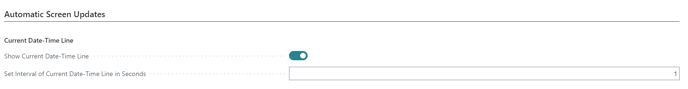
- whether the current date-timeline is shown and how often it should be updated
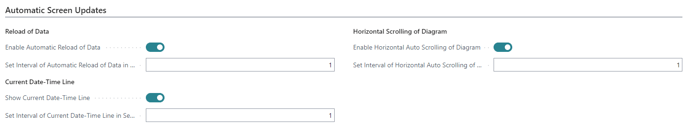
Scheduler mode
- whether the current date-timeline is shown and how often it should be updated