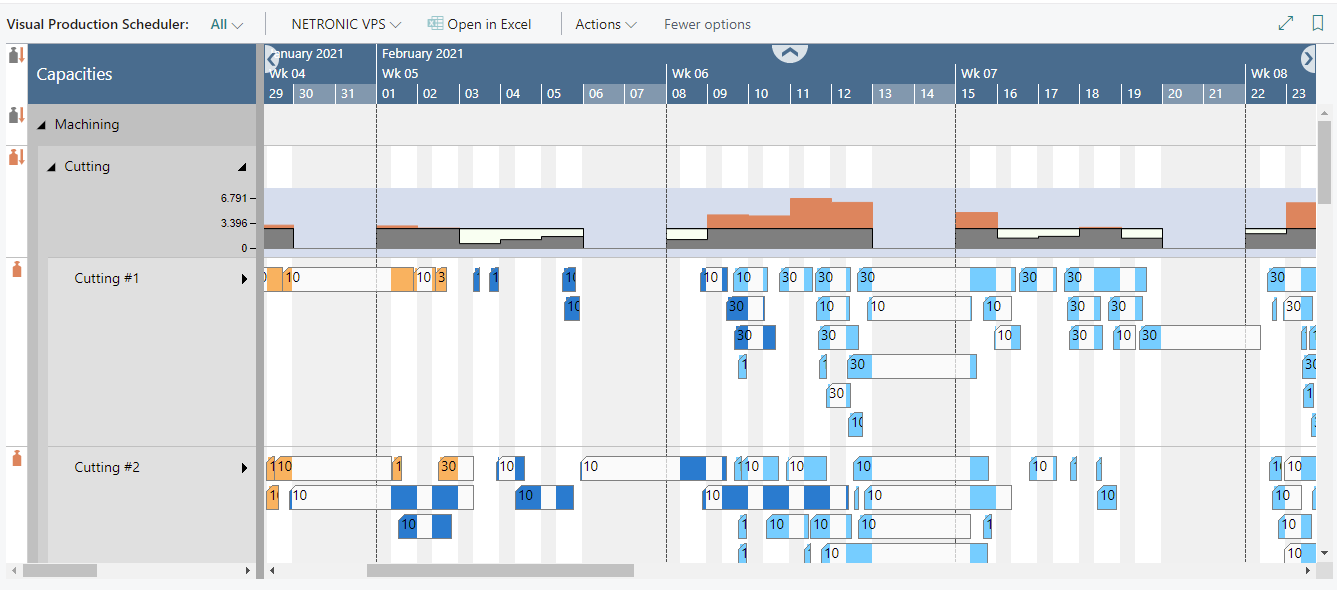
Elements and symbols in the Capacity View
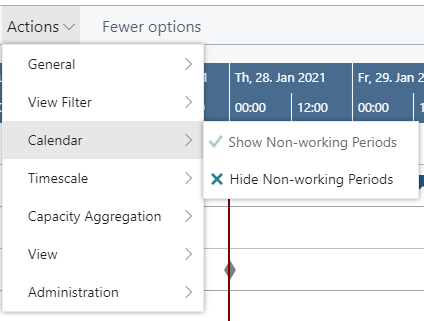
Calendar
A calendar in the background of the Gantt chart shows non-working times in grey, working times in white. By clicking the according menu items, non-working periods can either be hidden or shown.
Bars
Each operation of a production order is represented by a bar, the color of which depending on the belonging order's category and the selected view color mode, during work times and a few shadings brighter during non-working times (also see below "Calendar").
The following information can be gathered from optical indicators:
- Currently marked operation:
- Operation changed but not saved yet

- Violated due date

Operation with zero setup and runtime
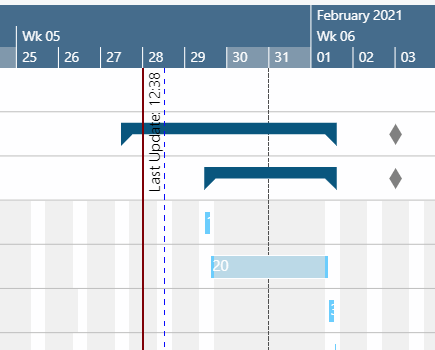
Sometimes there will be operations that don't occupy any capacity, e.g. drying phases. Such operations will be visualized now in the Capacity View by a vertical line so that you can still see that something's going on there but not using any capacity.
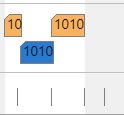
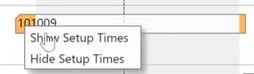
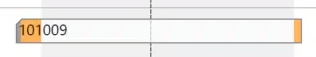
Setup times
Show or hide the setup times by a context menu.
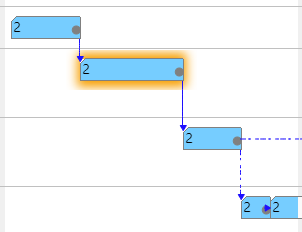
Links
Links between operations are shown after having clicked one operation of the according production order.
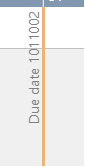
Due date
If you click an operation, a vertical line in the color of the operation's status appears, indicating the due date.
Update line
The update line indicates the time when your plan was last updated.
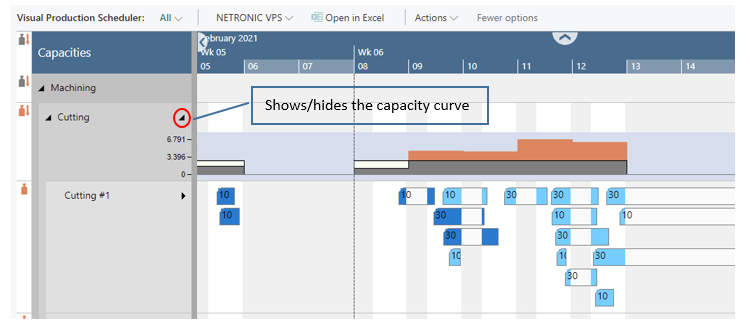
Capacity information
In the VPS, you can show a capacity curve in the Capacity View, to see free and exceeded capacities, a red box indicating an overload.
Besides, according symbols in the table part show capacity bottlenecks.
You can also change the capacity aggregation period.
The meaning of the symbols in detail:
 No overload at the parent resource (group) but at one or more subordinate resource(s)
 Overload at the resource (group) itself and at one or more subordinate resources
 Overload only at the resource (group) itself
Please note that if there isn't any overload in the complete plan the symbol column will not be shown.
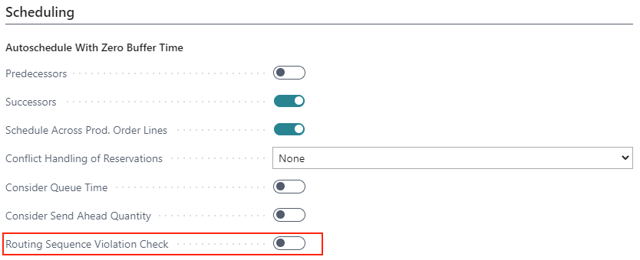
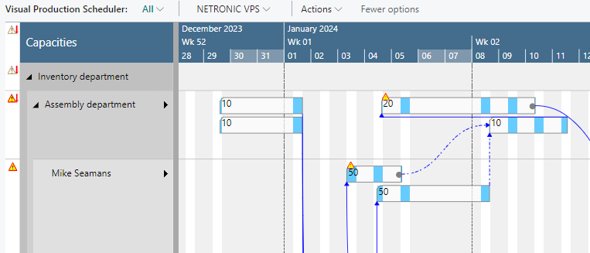
Sequence violation
The sequence of operations in BC is determined by routings (and reservations). If a production order is created or recalculated, the operations are arranged according to these specifications. In the planning board, these operations can be moved in relation to each other, thus perhaps causing sequence violations.
The VPS now draws attention to these "not allowed" overlaps by symbols at the concerned elements and in the table part, where the information is "passed up" to the parents in order to indicate the overlap even in collapsed state or when the element is scrolled out of view.
The meaning of the symbols in detail:
 |
The element has a sequence violation. Shown at the bar or in the table. Can be displayed in the production order view at the production order routing line, in the capacity view at machine/workcenter. |
 |
A child element has a sequence violation. Shown in the table header and both in the production order view for production order lines/production orders or in the capacity view for work center groups and work centers. |
 |
Sequence violations in the element itself and in child elements. In case of the work center, there may be, for example, a sequence violation of a production order routing line of the work center and a sequence violation of one of its machine centers. |
The feature gets activated/deactivated in the "Scheduling" area of the "Setup" dialog: