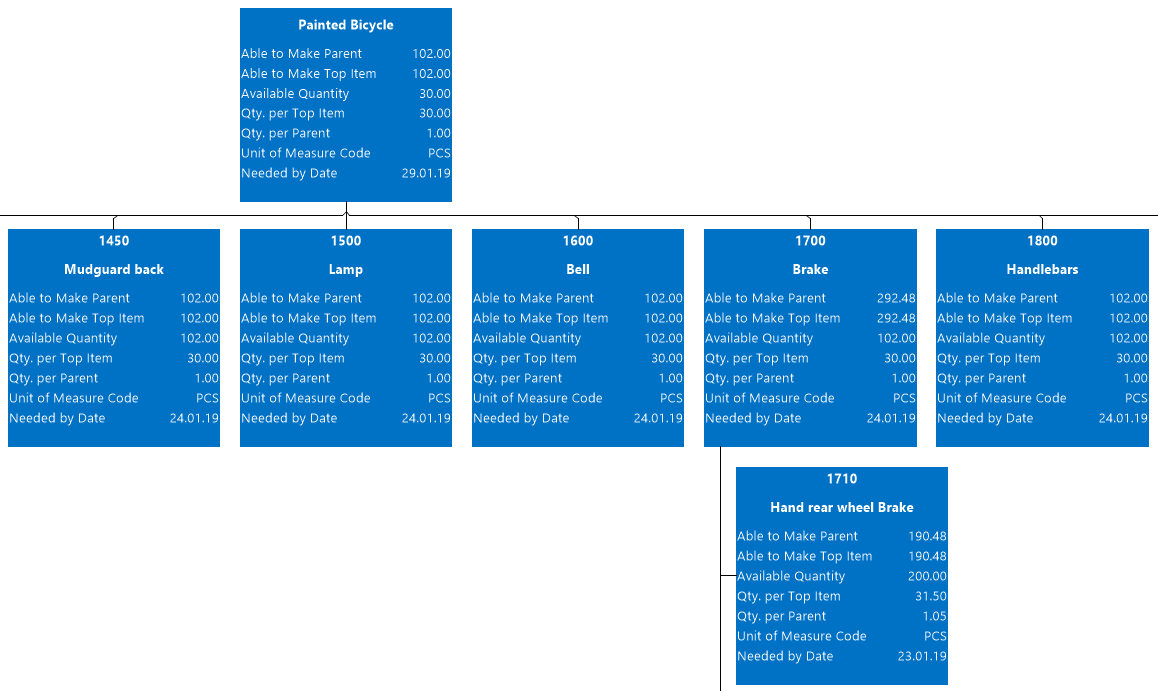
A key challenge in production planning is ensuring the necessary supply of materials
If in production just one little part needed for a certain product is missing, the whole production process might come to a halt. But it is not only shortage of material that should be avoided - either a too high stock of materials runs counter to the principles of material management.
So the question is how to best cope with this problem
Example case
For illustrating the valuable support of a visualized form of a BOM, I picked the example of a situation, that, as I believe, all of you are familiar with.
Just imagine: The production schedule is released, capacity utilization is high and all processes are running smooth ... when a customer calls and asks if you can finish his production order two days earlier. Especially short-term changes to the production schedule require transparent information about the material availability, about capacity bottlenecks and delivery time conflicts. Now its’s important to quickly gain clear-cut overview which could be quite a bit cumbersome when only done with the help of the NAV BOMs.
Let the visual BOM take over
As described in chapter "The bill of material (BOM)", the visual BOM of the VPS provides immediate insight into the material availability by showing a tree chart view of the bill of material, the data fields being taken from NAV.

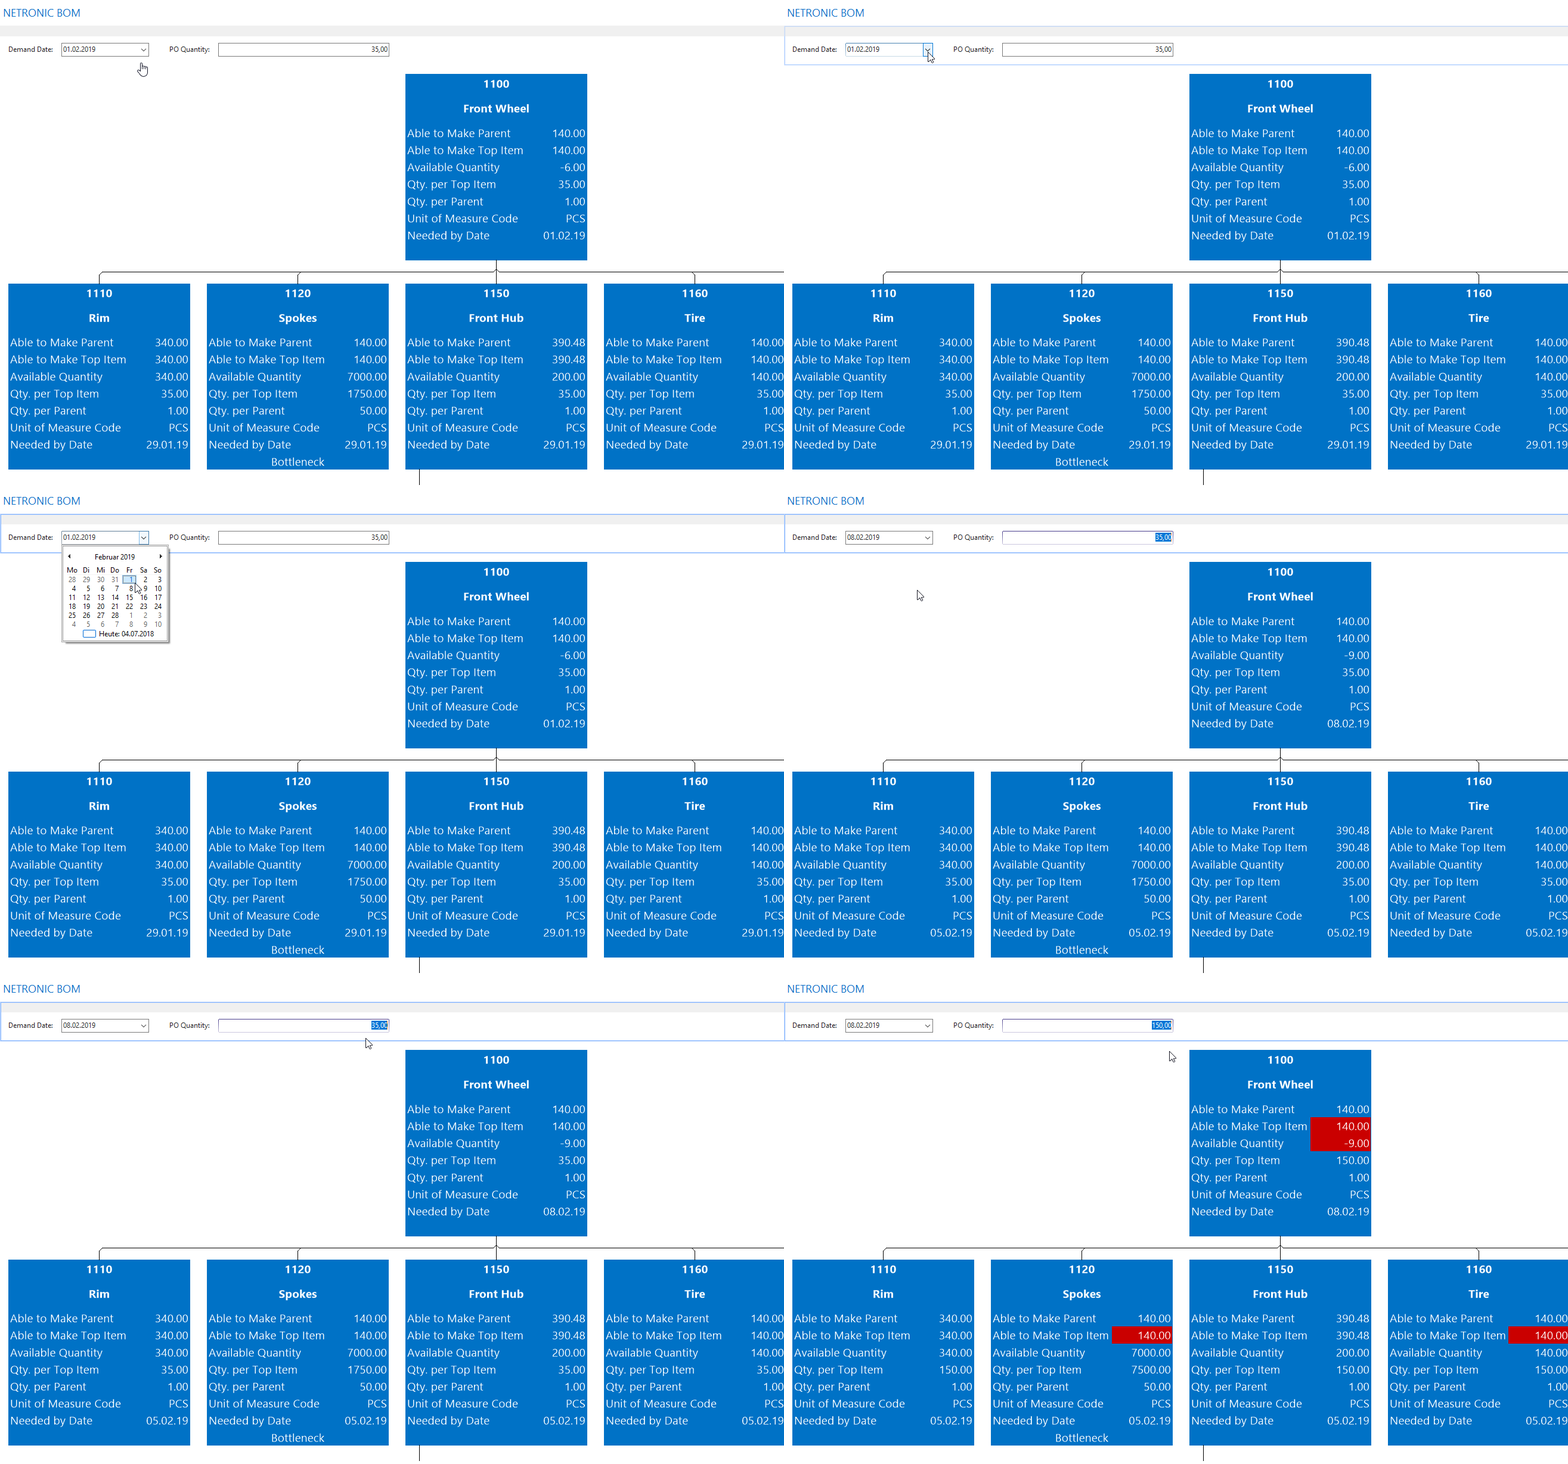
Check material availability by date or by quantity
Furthermore, the BOM lets you simulate the material availability not only for the planned start date and quantity of this production order but you can also check the availability at other dates or for other quantities by changing the values with a date picker.

When committing the date/quantity change by pressing ENTER, the visual BOM immediately simulates the material availability for that specific production order with the new values, letting the planner immediately see whether he can start earlier or not. In the latter case, he also sees the missing components and subassemblies and can take further actions accordingly.
Please note that only the modified demand date will be saved to NAV after having confirmed with OK, the PO Quantity will not be changed.

Keep your overview - even if your products have many components
Starting with the second hierarchy level, the planner can collapse and expand individual trees of the visual BOM. This helps him to quickly switch between high-level and detailed information.

Tip: Use font colors for indicating material shortfalls
In addition to the above described visual BOM, the VPS lets you highlight material shortfalls by indicators. As being outlined in the chapter about custom indicators, there are various sensitive areas in the operational processes of manufacturing companies the planner has to pay particular attention to. One of these areas is certainly the overview of whether enough material for a certain order is on stock.
The indicator functionality in the Visual Production Scheduler allows to modify the main font color (from 27 available colors) of the planning table responding to individual business logic. So you could, e.g., let material shortfalls appear in red font color. Following the instructions given in the above mentioned blog, you can choose whether to modify the font color in the table area on Production Order level and/or on operation level in the Gantt chart area.
In the following screenshot the red Production Order number in the table area indicates a material shortfall for this order, this shortfall getting further specified in the diagram area by indicating the respective operation by a purple Production Order number.

