The Resource View shows resource groups and their respective resources thus visualizing capacity bottlenecks and date conflicts.
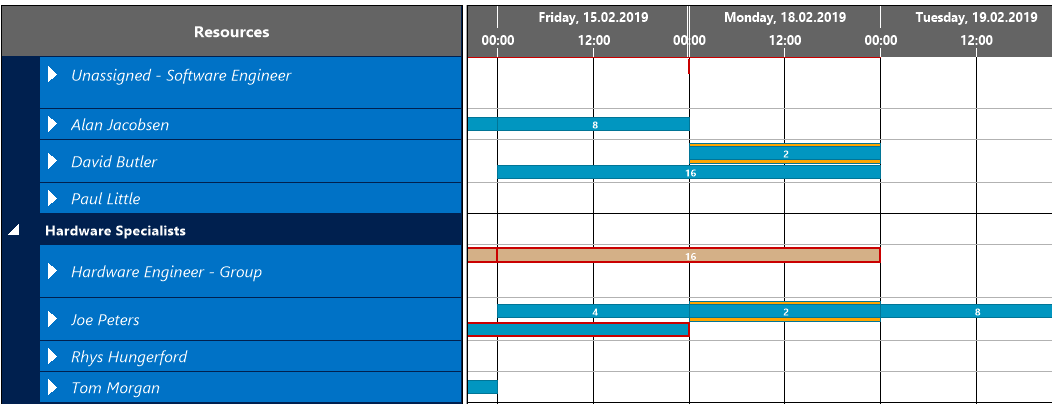
Elements and symbols in the Resource View
Calendar
A calendar in the background of the Gantt chart shows weekends in grey, working times in white. By clicking the according icons, weekends can either be hidden or shown.
Bars
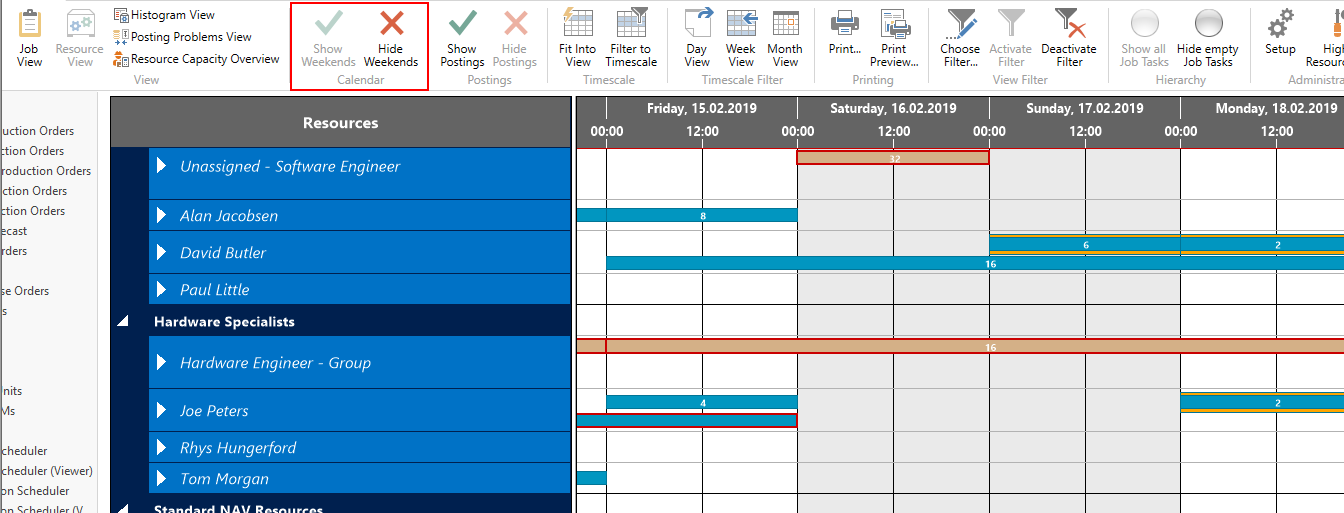
Each job task is represented by a bar, the color of the job planning line bars depending on the job's category (except in the "Completed" status, where these bars are grey). Clicking one task will mark all tasks belonging to this job which is shown by an orange frame. A red frame indicates changes having not been saved yet.
Categories
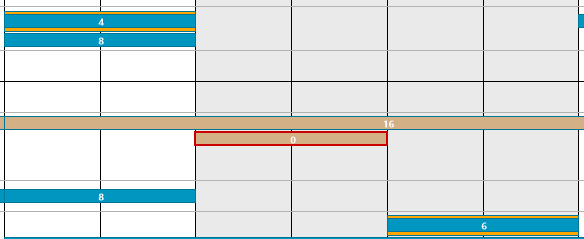
In the Job View, categories are distinguished by different colors.
Sorting order
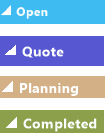
Within a resource group, resources are sorted in ascending alphabetical order.
Unassigned tasks
If you use "dummy" resource groups for your rough planning, the white number on a red background tells you how many planning lines are assigned to the group and not to a fix resource yet.

Milestones
By modifications of the C/AL code the VJS can display milestones either on Job level and on Job Task level.
Milestones on Job Task level
After having activated them, the following cases will be illustrated by milestones :
- No discrepancies (grey)The actual start date is later than the milestone Start (red)
- The actual end date is later than the milestone End (red)

Milestones on Job level
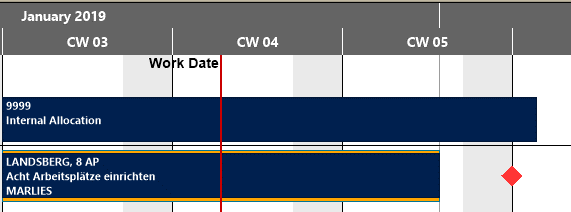
Milestones on Job level are used for indicating a planned delivery date (or similar) for your jobs by a grey diamond shaped symbol turning red in case of the date getting exceeded. The date of the milestone symbol can’t be modified by drag & drop.
Histograms
A histogram below the Gantt chart displays the workload of the corresponding resource. When moving the mouse onto a resource group or a resource, its capacity load will be visualized in the histogram. The sections highlighted in red indicate a capacity problem at the machine center „Mary A. Dempsey" that ought to be solved by rescheduling.

In the Resource View, the histogram of a certain resource/resource group can be displayed independent of the position of the mouse cursor. Right-click on a resource or resource view and click “Fixate Histogram”.
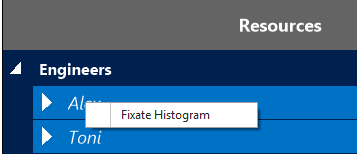
The name of the resource group/resource gets displayed in yellow:

...and only the histogram of this resource will be displayed, even when the mouse cursor is being moved.
