Elements and symbols in the Resource View
Calendar
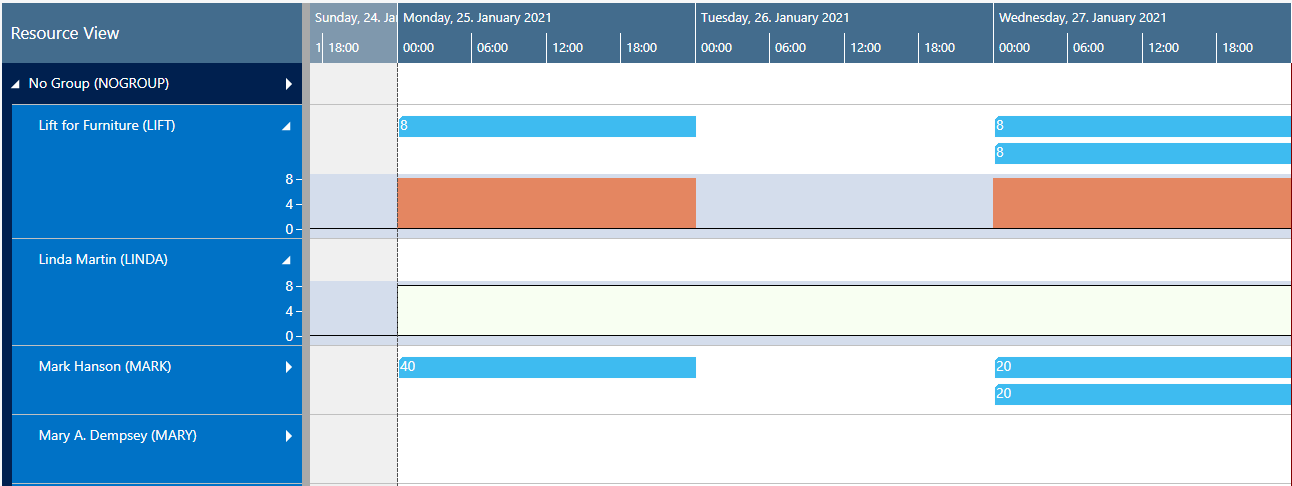
A calendar in the background of the Gantt chart shows weekends in grey, working times in white.
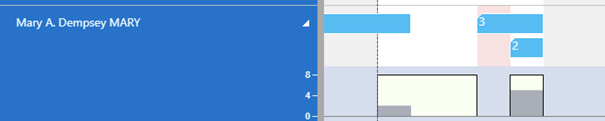
Absences of employees that are linked to resources are visualized in a light pink in the calendar and by a corresponding capacity curve.
Bars
Each job task is represented by a bar, the color of the job planning line bars depending on the job's category. The Job categories are indicated as follows:

A red frame indicates changes having not been saved yet, the orange frame highlights the currently marked task.

Sorting order
Within a resource group, resources are sorted in ascending alphabetical order.
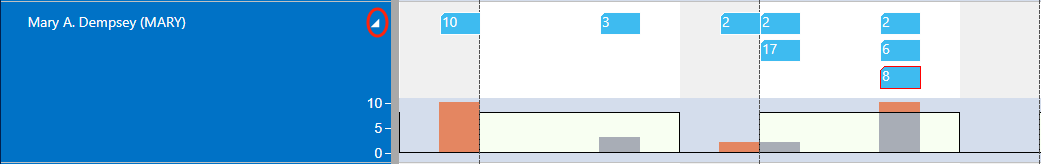
Capacity curve
In the VJS, you can show a capacity curve in the Resource View to see free and exceeded capacities, a red box indicating an overload:
Creation mode
With the help of the creation mode, planners can interactively allocate a job task to a resource by dragging it from the list to the chart.
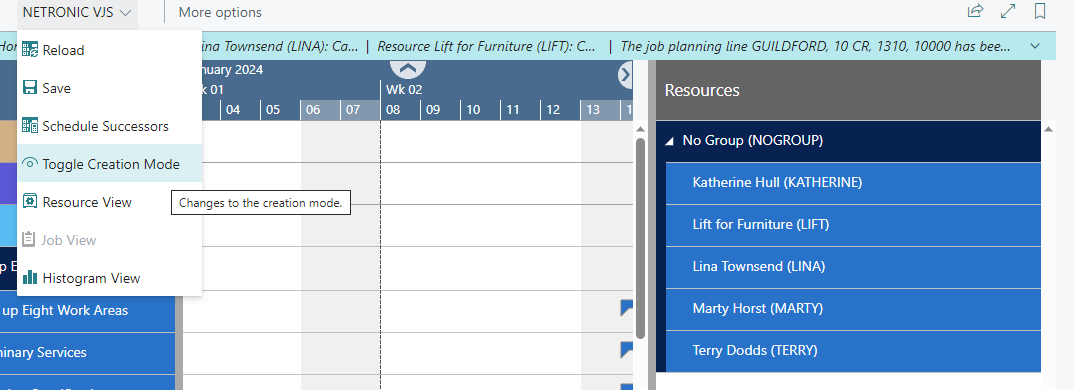
Find detailed information about the creation mode here.