- Visual Scheduling Tips & Tricks
- Visual Jobs Scheduler (VJS) for Dynamics 365 Business Central
- Working with the schedule in the VJS
-
Visual Advanced Production Scheduler (VAPS) for Dynamics 365 Business Central
- Support
- Release and version status
- Installing the VAPS
- Look and feel of the visual schedule
- The view color modes
- Setting up the VAPS
- Integrating with Microsoft Dynamics 365 Business Central
- Finite Capacity Scheduling Instruments
- Simulations
- Day-to-day use cases
- Coding tips (for partners)
- API Events VAPS
-
Visual Production Scheduler (VPS) for Dynamics 365 Business Central
-
Visual Jobs Scheduler (VJS) for Dynamics 365 Business Central
-
Visual Production Scheduler (VPS) for Dynamics NAV
-
Visual Job Scheduler (VJS) for Dynamics NAV
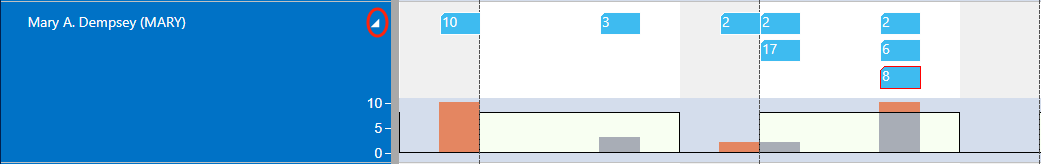
Capacity information
In the VJS, you can show a capacity curve in the Resource View, to see free and exceeded capacities, a red box indicating an overload
