Elements and symbols in the Capacities View
Calendar
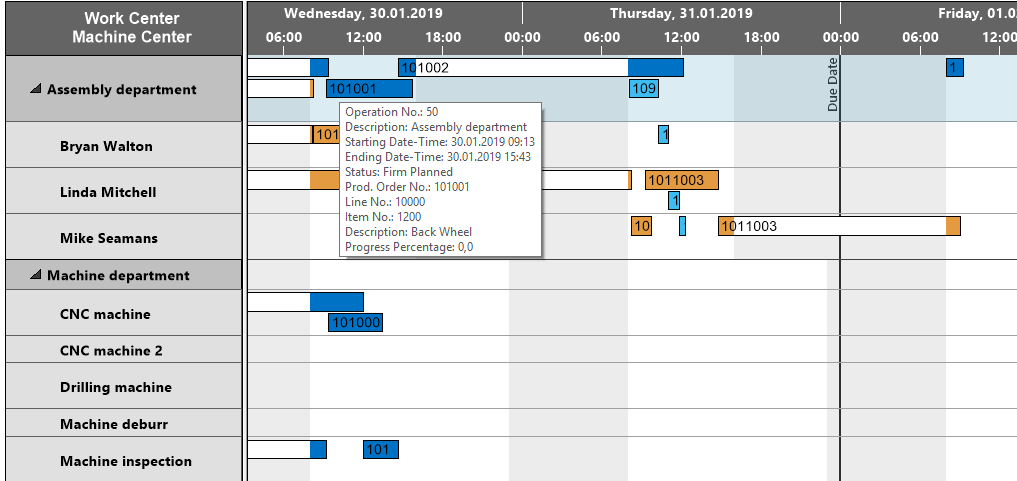
A calendar in the background of the Gantt chart shows non-working times in grey, working times in white. By clicking the according icons, non-working periods can either be hidden or shown.
Bars
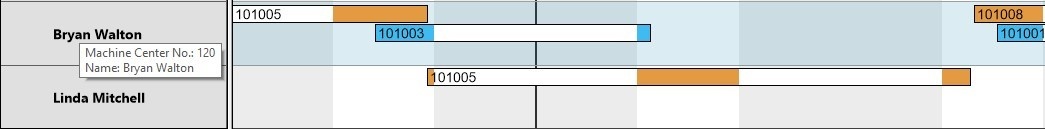
Each operation of a Production Order is represented by a bar, the color of which depending on the belonging order's category. The bars of the operations are colored during working times and white during non-working times.
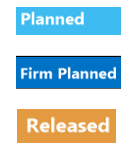
Categories
Categories in the Capacities View are distinguished by the same colors as in the Production Order View.
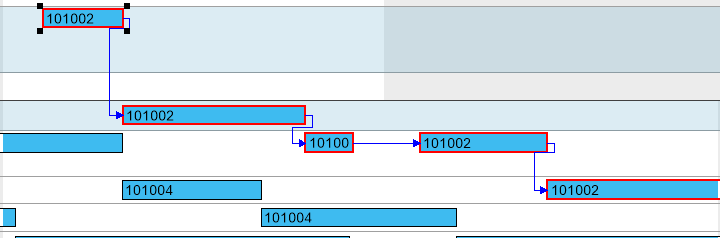
Links
Depending on the settings you have specified in the "Setup" dialog, links between operations are shown after having clicked one operation of the according Production Order.
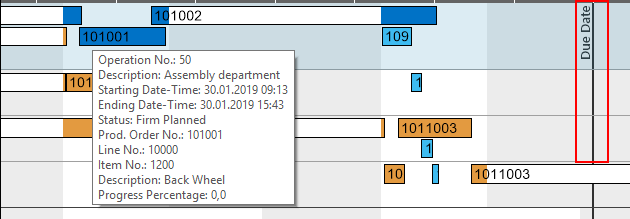
Due date
When moving the mouse cursor over an operation, the according due date is shown .
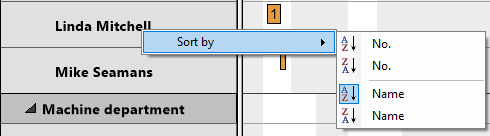
Sorting order
To change the sorting order of either work center or machine center, open the context menu of the according center:
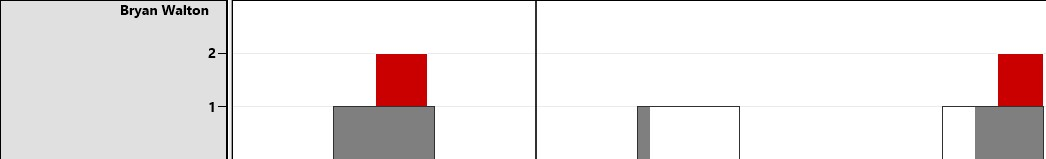
Histograms
A histogram below the Gantt chart displays the capacity load of the according work center/machine center. When moving the mouse onto a work or a machine center in the Capacity View, its row will temporarily be marked by a bluish-grey background thus being selected to be visualized in the histogram.
In the histogram, the sections highlighted in red indicate a capacity problem at the machine center „Bryan Walton“ that ought to be solved by rescheduling.