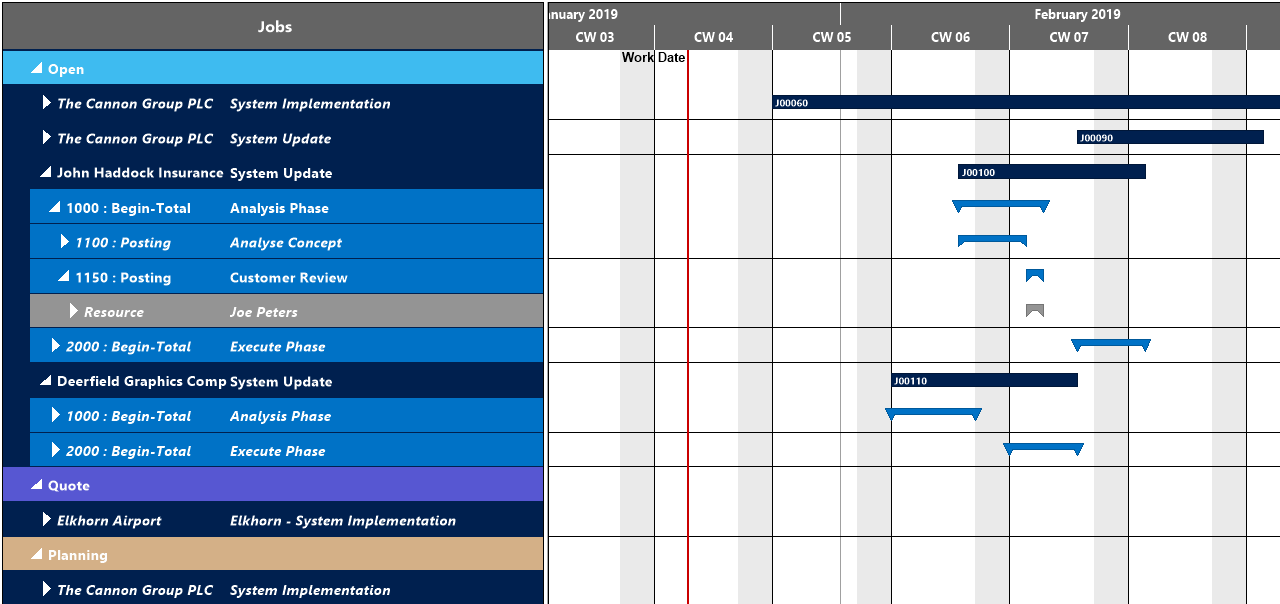
Elements and symbols in the Jobs View
Calendar
A calendar in the background of the Gantt chart shows weekends in grey, working times in white. By clicking the according icons, weekends can either be hidden or shown.
Bars
Each job, job task and job planning line is represented by a bar, the color of the job planning line bars depending of the job's category (except in the "Completed" status, where these bars are grey).
- Job
- Job task line

- Job Planning Line - the red frame indicating a change not having been saved yet

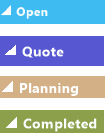
Categories
In the Jobs View, categories are distinguished by different colors.
Sorting order
Within a category, jobs and their belonging tasks are sorted in ascending numerical order.
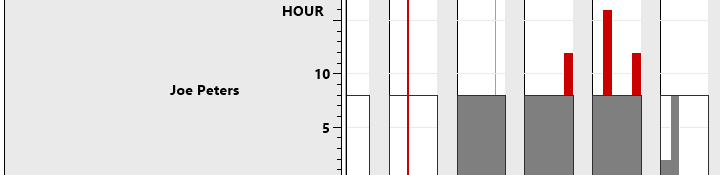
Histograms
A histogram below the Gantt chart displays the workload of the corresponding resource. When moving the mouse onto a resource group or a resource, its capacity load will be visualized in the histogram. The sections highlighted in red indicate a capacity problem at the according resource (in this case „Joe Peters”) that ought to be solved by rescheduling