- Visual Scheduling Tips & Tricks
- Visual Job Scheduler (VJS) for Dynamics NAV
- Basics of the VJS
-
Visual Advanced Production Scheduler (VAPS) for Dynamics 365 Business Central
- Support
- Release and version status
- Installing the VAPS
- Look and feel of the visual schedule
- The view color modes
- Setting up the VAPS
- Integrating with Microsoft Dynamics 365 Business Central
- Finite Capacity Scheduling Instruments
- Simulations
- Day-to-day use cases
- Coding tips (for partners)
- API Events VAPS
-
Visual Production Scheduler (VPS) for Dynamics 365 Business Central
-
Visual Jobs Scheduler (VJS) for Dynamics 365 Business Central
-
Visual Production Scheduler (VPS) for Dynamics NAV
-
Visual Job Scheduler (VJS) for Dynamics NAV
The Histogram View
The Histogram View shows all histograms of resource groups and resources in the same order as the resource view.
Elements and symbols in the Histogram View
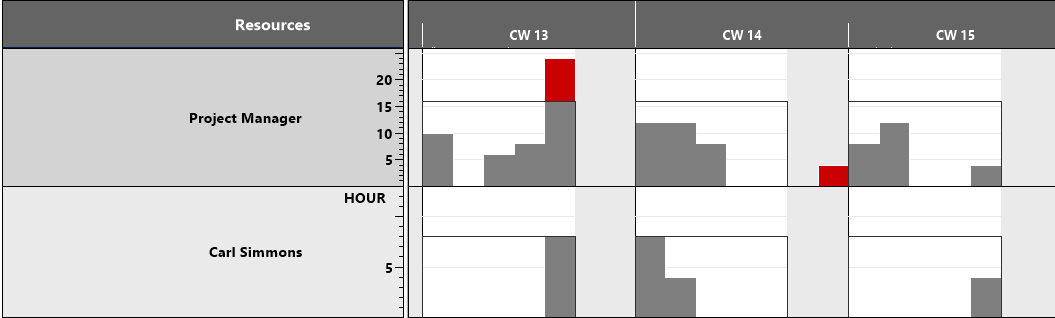
Distinguishing Resource Groups/Resources
In the table, the resource groups are highlighted in a darker grey than the resources.
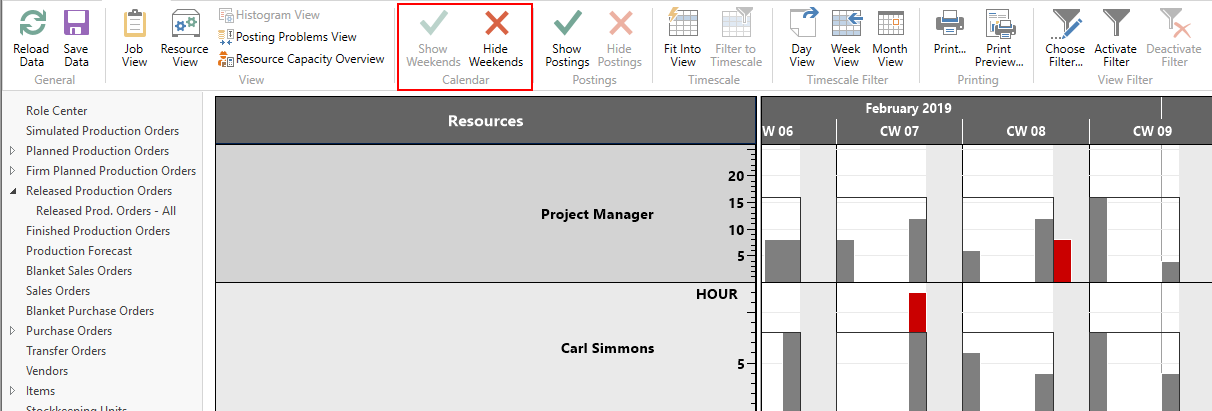
Calendar
A calendar in the background of the Gantt chart shows weekends in grey, working times in white. By clicking the according icons, weekends can either be hidden or shown.
