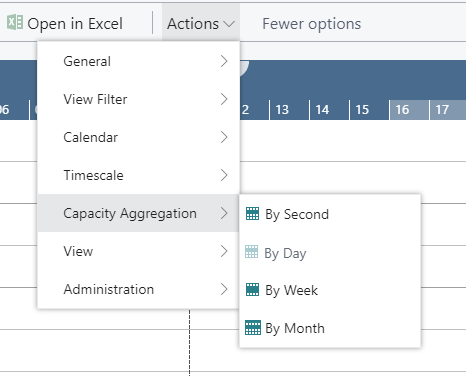
Capacity calculation by either second, day, week, or month
The capacity curve combines information on a resource's allocation and its availability. If, for instance, a task's duration is 10 hours, the capacity curve of a resource with an availability of 8 hours/day shows an overload - if it is calculated per day. In many cases, the planner regards a resource's availability by week or even by month. That is why the VPS lets you select wether you do the capacity calculation either by second, day, week, or month. The curve will aggregate the occupancy on the selected period.