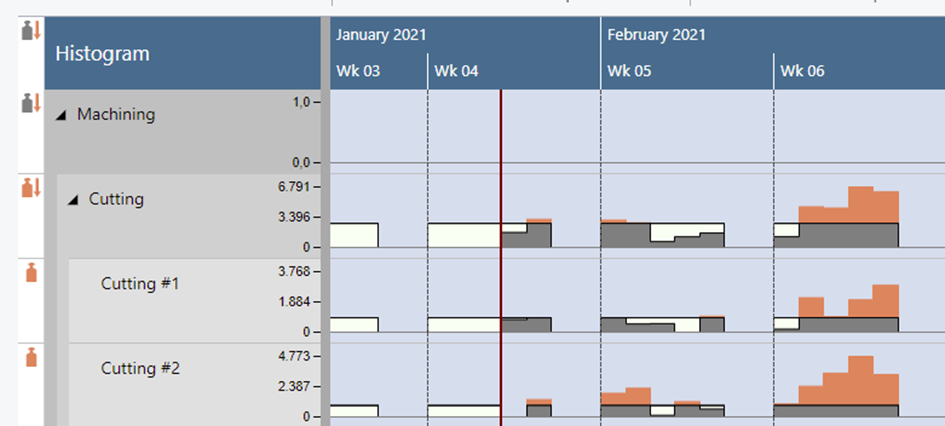
In the Histogram View, the histograms of the work centers and their respective machine centers are displayed. You directly recognize free and exceeded capacities, a red box indicating an overload.
Overloads at a resource are indicated by a red box in the chart and according symbols in the table part.
You can also change the capacity aggregation period.
The meaning of the symbols in detail:
 No overload at the parent resource (group) but at one or more subordinate resource(s)
 Overload at the resource (group) itself and at one or more subordinate resources
 Overload only at the resource (group) itself