- A timescale at the top.
- A table displaying either production orders (in the Production Order view) or work/machine centers (in the Capacities View) at the left.
- On the right below the time scale, the chart displaying the production orders and their production order lines as bars.
- A calendar in the background of the Gantt chart: non-working times are highlighted in grey, working times in white. The bars of the operations are colored during working times and just white during non-working times.
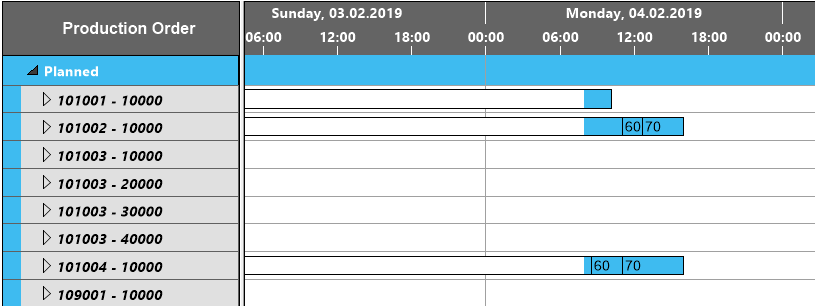
Picture 1: Production Orders in the Production Order View
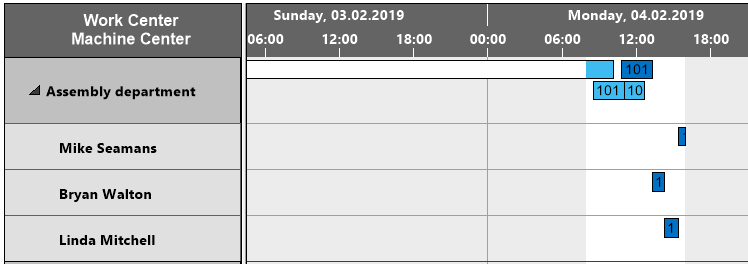
Picture 2: Production Orders in the Capacities View