- A timescale at the top.
- A table at the left, listing jobs (in the Job View) or resource groups/resources (in the Resource View and Histogram View.
- On the right · next to the table - a Gantt chart displays the job schedule .
- A calendar in the background of the Gantt chart: workfree periods are highlighted in grey, working times in white.
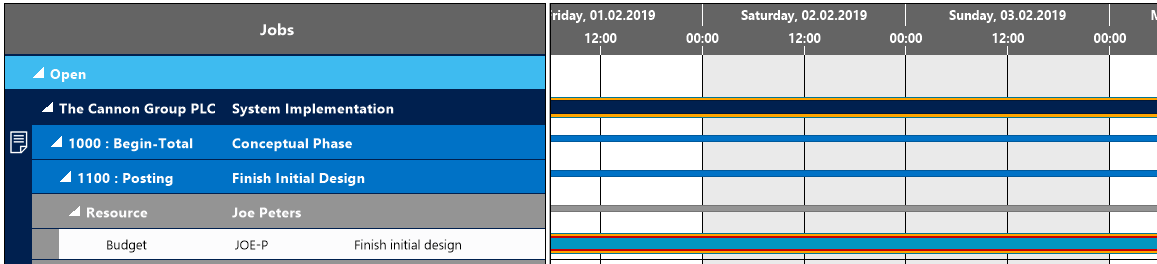
Picture 1: Jobs in the Job View
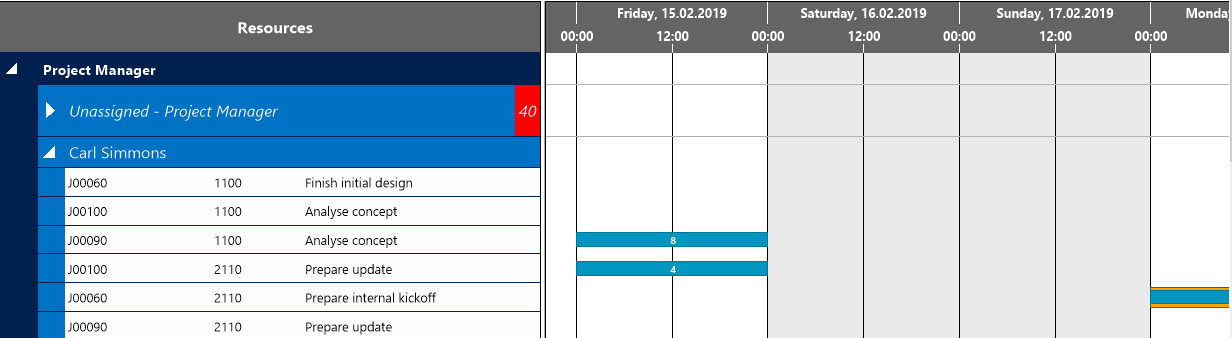
Picture 2: Jobs in the Resource ViewView