
The meaning of the icons in detail:
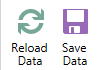
- After modifications you might have to reload or save the data
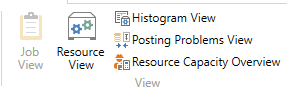
- Switch views depending on which aspects of your data you want to emphasize
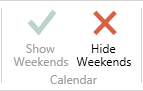
- Switch on or off the display of weekends in the diagram.
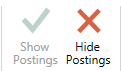
- Show/hide posting problems as described under “The Posting Problems View”.
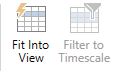
- The timescale gets either minimize or maximized so that the chart shows the complete timespan as defined in the “Settings” dialog or the chart gets adjusted to the current timescale showing only projects fitting into this range. The latter option reduces the number of displayed bars.
- Show projects of a certain timespan only:
- all projects of your current workdate
- all projects within a week starting from the current workdate
- all projects of a month starting from the current workdate
- Print your chart as displayed on the screen and only specify the usual print settings like number of copies, pages to be printed, etc.
- Printing options, like paging, page numbers, recurrence of time scale, table and legend on printed pages can be specified in the “Page Setup” dialog that is to be reached from the “Print Preview” dialog.
- Use filters: By "Choose Filter" you open the “Filter List” dialog where you can create, edit, and select filters. By clicking the according button you can apply the filters you selected in the “Filter List” to your current view or deactivate them.
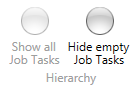
- Job Tasks without resources matching the currently active View Filter criteria, can be shown/hidden
- The “Setup” dialog of the VJS allows to specify the basics concerning the timespan of your schedule, to configure data filters and tooltips and labels, and to make general settings .
- Resources with certain skill(s) can be highlighted.