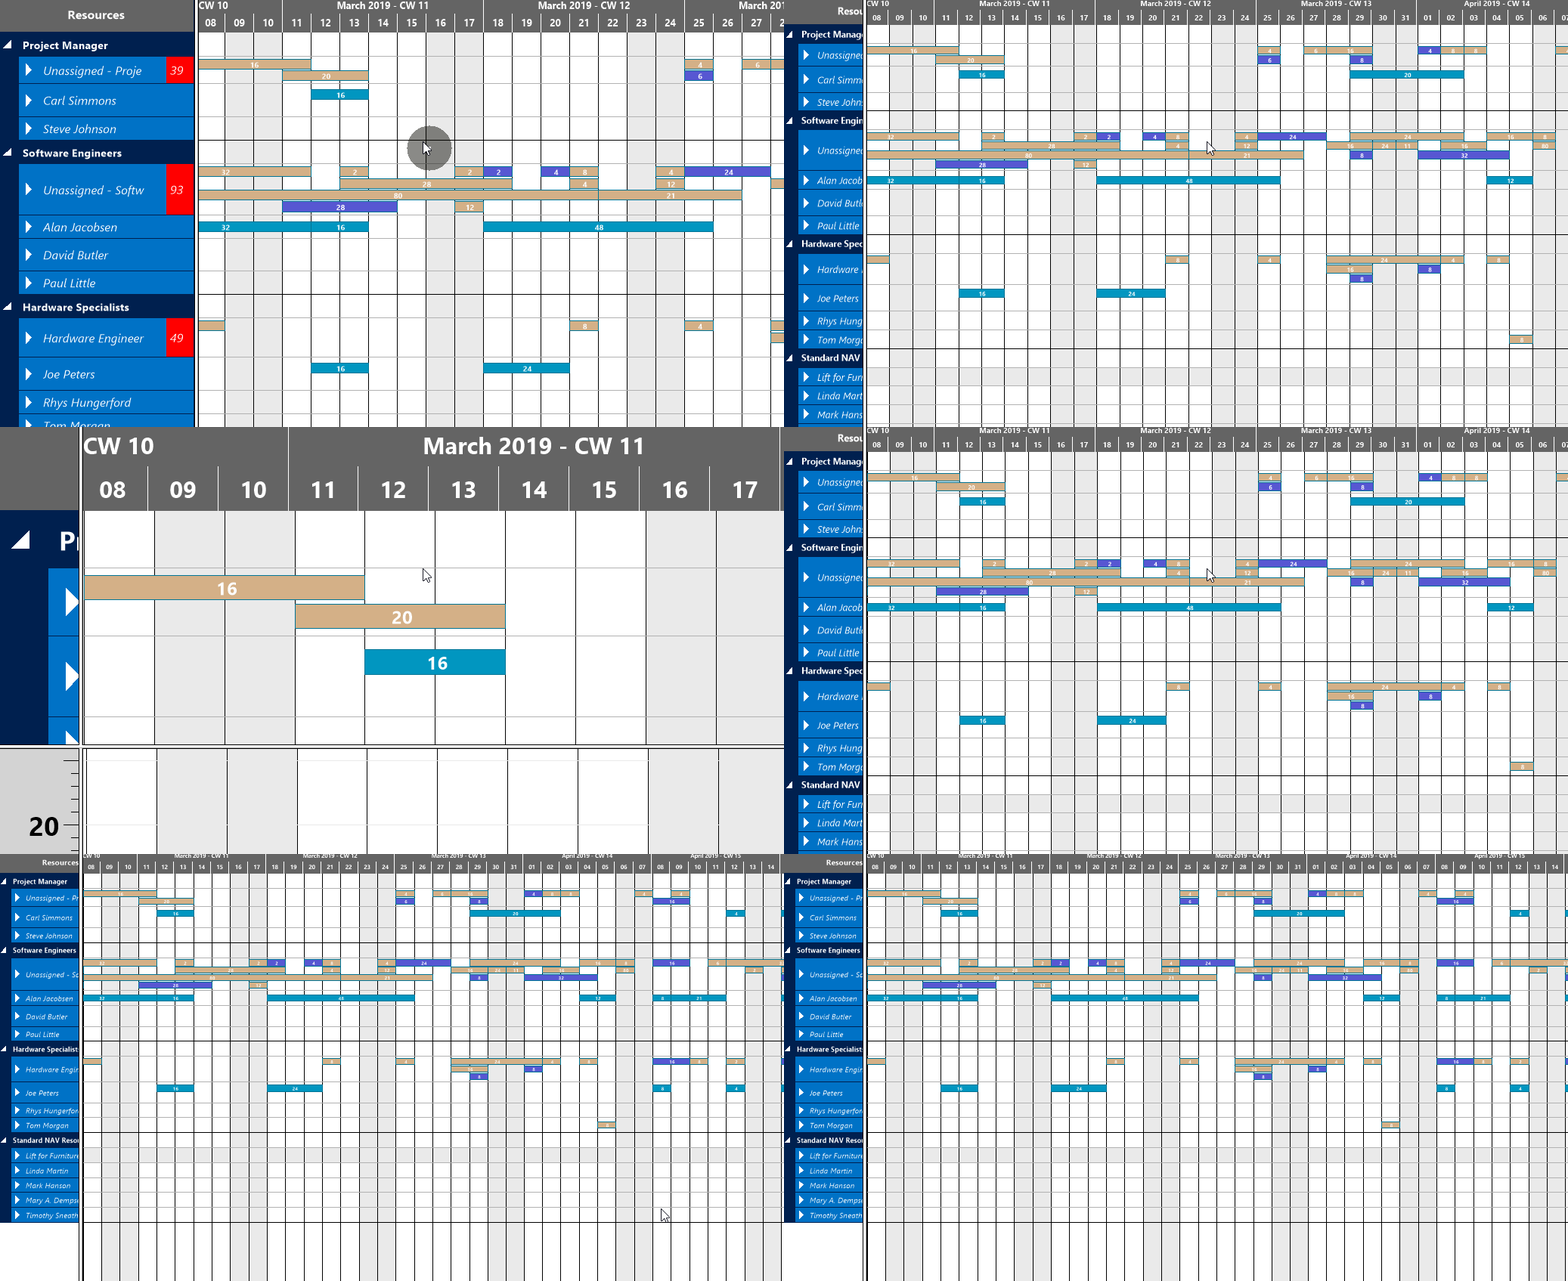
The Visual Jobs Scheduler offers various options for adjusting the size of your working area.
Adjust the time scale
Increase/reduce time scale solution
Depending on how much detail or summary is required, you can either increase or reduce the time scale solution by
- mouse wheel within the time scale
- <Shift> + mouse wheel outside the time scale

Show projects of the current timescale only

The chart gets adjusted to the current timescale showing only projects fitting into this range thus reducing the number of displayed bars.
Show projects of a certain timespan only
Click the according icon to show either
- all projects of your current workdate
- all projects within a week starting from the current workdate
- all projects of a month starting from the current workdate

Return to default time range

The timescale gets either minimized or maximized so that the chart shows the complete timespan as defined in the “Settings” dialog.
Enlarge/reduce diagram
Zoom the diagram in or out by <Ctrl> + mouse wheel.

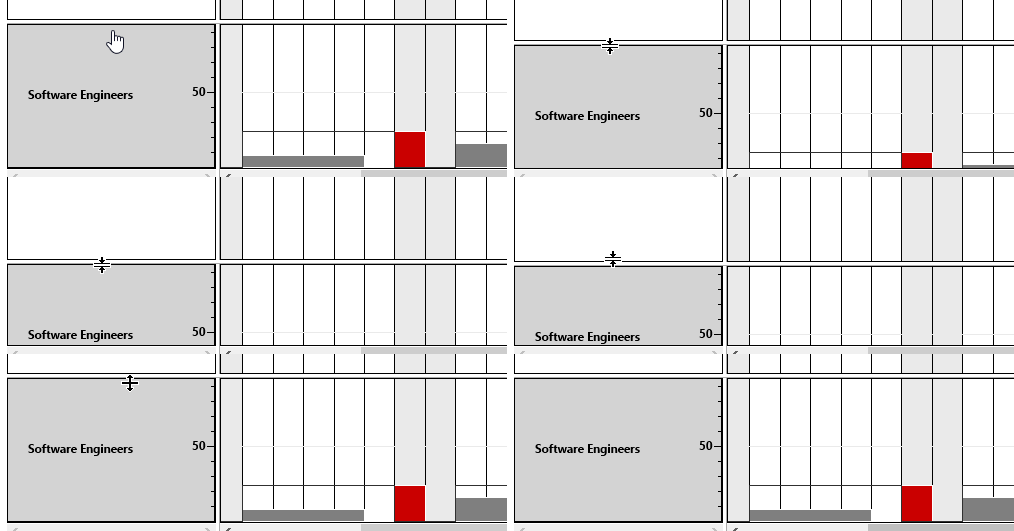
Adjust the numeric scale of the histogram
If you wish to modify the resolution of the numeric scale in the histogram, place the mouse cursor on the numeric scale and drag it either upward (enlarging) or downward (reducing).

Adjust the height of the histogram
Accordingly, you can modify the height of the histogram. Drag the horizontal splitter bar between histogram and table/diagram area upward or downward

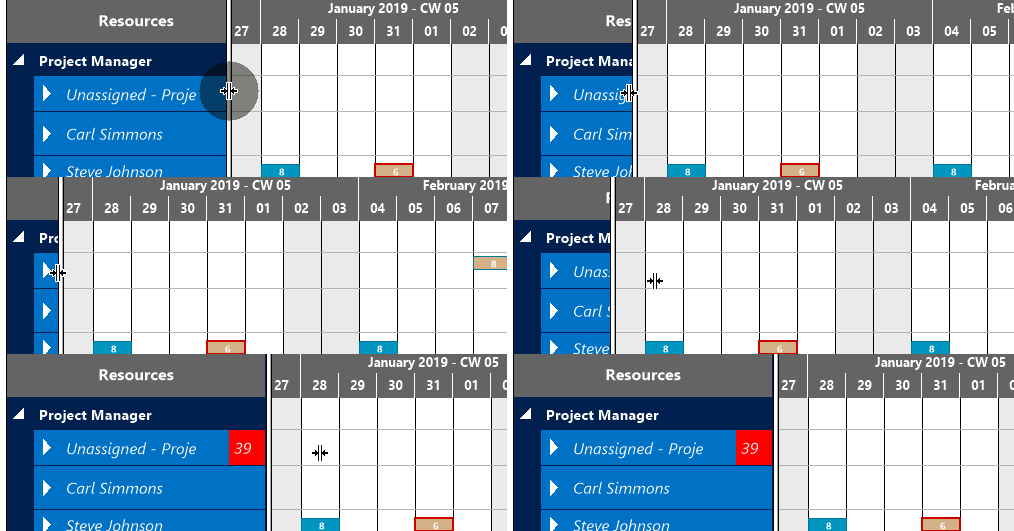
Adjust the width ratio between table and diagram
You can modify the width ratio between the table and the diagram by moving the vertical splitter bar between them.

Shift timescale
Bring another section of your timescale into view by grabbing the timescale by mouse and shifting it.

