Create your own visual alerts to highlight conflicts with individual business rules at operational level.
In addition to the visual alerts indicating impending collisions of scheduled orders with operational processes (red capacity curve for impending overload, hatching for delivery date exceeding and red underlining for overlapping operations) the VPS offers a feature for highlighting cases following your own business rules by changing the main font color of the planning table.
You can choose whether to modify the font color in the table area on Production Order Lines level and/or on operation level in the Gantt area. This is done by so-called indicators that have to be programmed externally. The color can be set by an ARGB value. The color value will be reduced internally to the nearest of 27 colors represented by all combinations of 0, 128 and 255 for the R, G and B values.
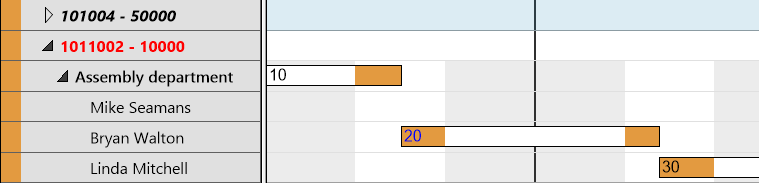
The following screenshot shows two indicators “at work”.
1. Indicator on production order line “1011002 – 10000” with font color red
2. Indicator on operation “20” of production order line “1011002 – 10000” with font color blue
Definition of an Indicator Object
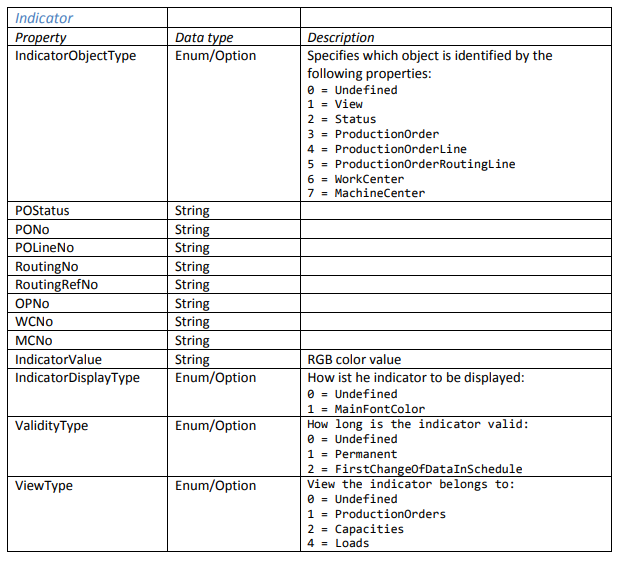
To set an indicator, an indicator object has to be created and the according properties identifying the objects the indicator is to be applied to have to be filled. This indicator object has to be added to a list so that if you have defined more than one indicator they will be applied one after the other. The following table shows the settings needed for an indicator object.
Applying indicators automatically after the VPS has been started
In order to apply your indicators automatically after having started the VPS, you have to modify the event OnDataLoaded. This could be done like shown below:
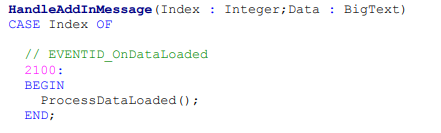
In our sample implementation, we have enhanced the event by the ProcessDataLoaded() function which calls the SetAllIndicatorsForSchedule() function to create indicators, equip them with values and handle them over to the VPS.
Sample code for creating an indicator
The following code snippet is taken from the SetAllIndicatorsForSchedule() code for creating an indicator for a „ProductionOrderRoutingLine“ (operation). In this code snippet, the necessary values for identifying the correct RoutingLine and color and validity are specified.
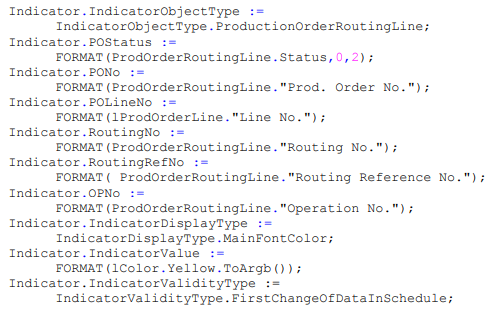
For the complete code of the sample implementation, see the SetAllIndicatorsForSchedule() function.
Applying indicators for selected objects by user interaction
In addition to applying indicators automatically upon starting the VPS, the decision whether to use indicators or not and at which position can be left to the user by offering an additional item in the context menu. This way of using indicators bears the advantage of reducing complex calculations since the user only retrieves them for certain selected objects.
Two steps are needed to use the indicators:
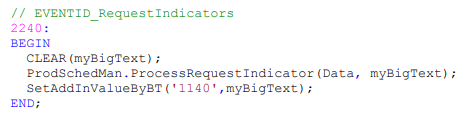
- Implement the ProcessRequestIndicator:
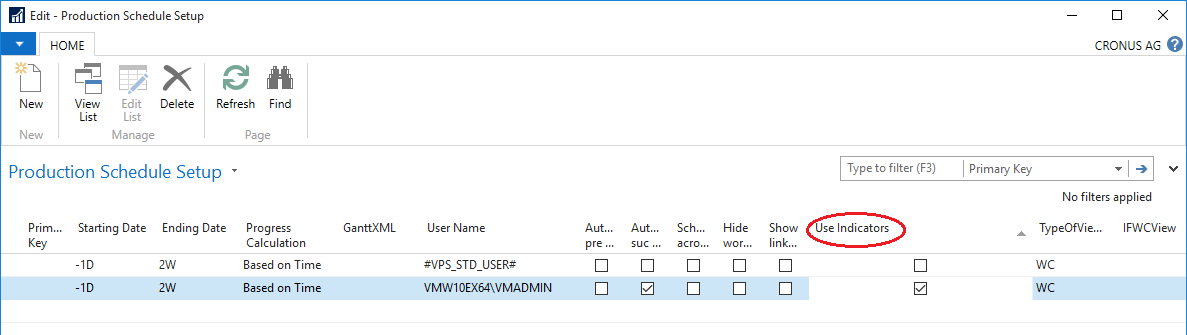
2. Tick the “Use Indicators” check box in the NAV Table “NETRONIC VPS Setup” (5416000)
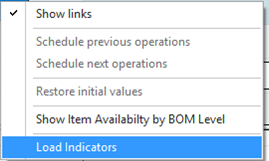
As a result, the item “Load indicators” or “Load and Save Indicators” respectively is added to the context menu: Please note that you cannot load an indicator if there are any unsaved changes in the planning board. As a consequence the context menu item will change to “Save and Load indicators” if necessary so that the user has to save his changes before the indicators can be set.
Clicking this item starts a request, the request object being of the indicator object type and specifying the object for which the indicator was requested. This could be an operation in the diagram area, e.g., or a group in the table area. The object at which the option was clicked determines the value set in the IndicatorObjectType property.
The complete sample code can be found in the ProcessRequestIndicator() function